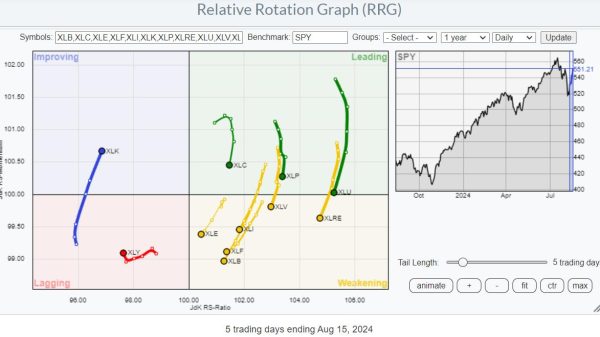
Investing in businesses can be a tricky proposition. It requires knowledge of the company’s balance sheet, income statement, and market dynamics. But savvy investors know the best way to assess a company is to look at their stock chart.
The stock chart of a certain company can reveal a wealth of information. For starters, it provides a quick visual snapshot of where the stock has been over a certain period of time. Investors can “eyeball” the chart to get a sense of the company’s business outlook and its present market capitalization. “Chartists” (a technical analyst of stocks) especially rely on this skill to determine the “trends” of a stock and make educated trading decisions.
But investors should know that relying too heavily on valuations of a company is the wrong approach. Price-earnings ratio, dividend yields, market capitalization—all of these metrics provide valuable insight, but they offer little real information about the underlying driver of the stock’s movement. Companies that show strong “fundamentals” may not always perform well in the stock market.
That’s why it’s important to look at the charts and compare them with company valuations to get a more holistic view of the stock’s overall performance. Charts can tell an investor how the larger market is reacting to a stock and whether it is currently overvalued or undervalued. This insight could be particularly helpful when there is a disconnection between the performance of the stock and the success of the underlying business.
By using charts, investors can quickly identify a stock’s overall trajectory, whether it is in an upward or downward trend. They can use this data to help them decide whether the stock is worth pursuing and time their trades accordingly.
Ultimately, the success of stock investing comes down to one thing: having a solid understanding of the market and the forces driving stock prices. Knowing which stocks are undervalued and overvalued is essential, but charts can help provide that extra layer of information and ensure an investor is making the best possible trading decisions.


